|
Ergonomic interface "Ribbon" similar to MS Office 2007/2010 interface allows forming command groups (buttons, icons) for effective implementation of EEG-studies according to purchased software and assigned tasks. 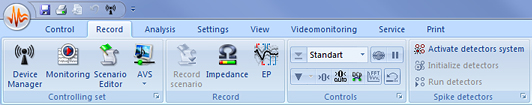
The main tabs: The tab "Typical" (i.e., a typical set of functions) is designed to accelerate and simplify a routine EEG. This tab allows carrying out each study from EEG record to analysis and protocol generation without switching to other tabs. It makes easier work with a large influx of patients and allows paramedical personnel and nursing staff to learn this software function. 
Tabs "Control" and "Record" provide a comprehensive set of functions for professional EEG record, including long-term studies. At the same time, it is always possible to return to the "Typical" mode. Installation of additional software developed by Medicom MTD Ltd. doesn’t require switching between different programs during study and successfully integrated new functions into the"Ribbon" interface. New icons appear in the corresponding tabs. New tabs, such as "Typical EP", "Typical VM", and others, are also integrated. As well as the tab "Typical", they provide a minimum set of functions required for usual work with this type of study. 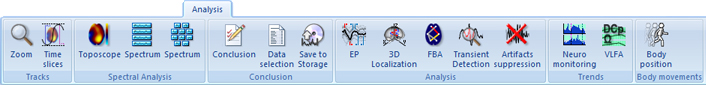
"Toposcope", "Save to Storage" and "Transient Detection" have appeared with "Professional version" of "Encephalan" software. "EP", "3D", "FBA" and "VLFA" are buttons launching additional software. 
Additional tab "Typical VM" contains all required functions for EEG videomonitoring. Montages library 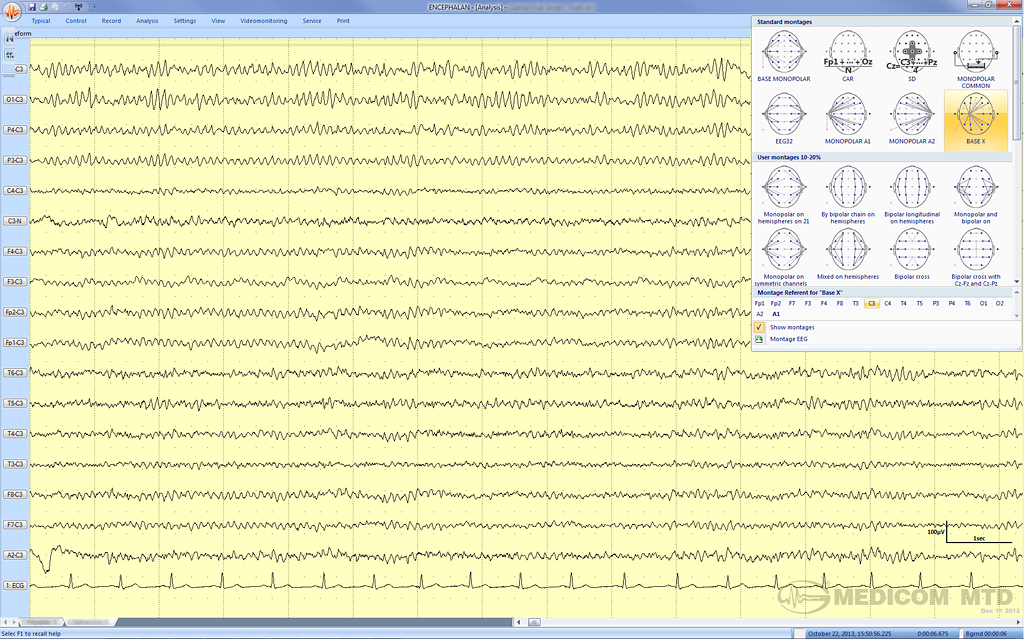
Electrode impedance measurement 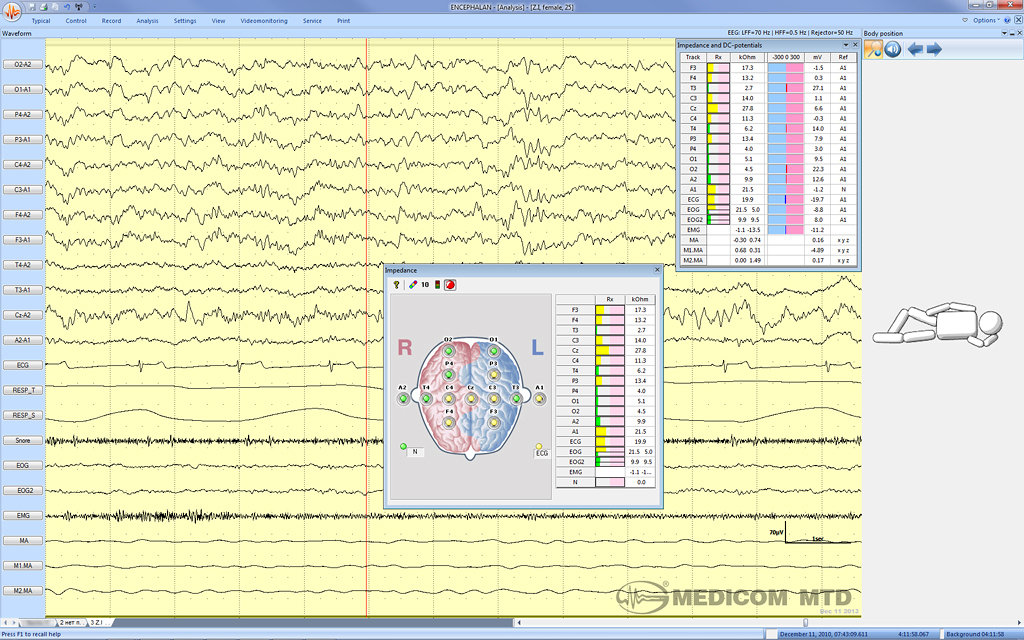
Channel grouping with an option of changing the sequence of channels on the screen with highlighting 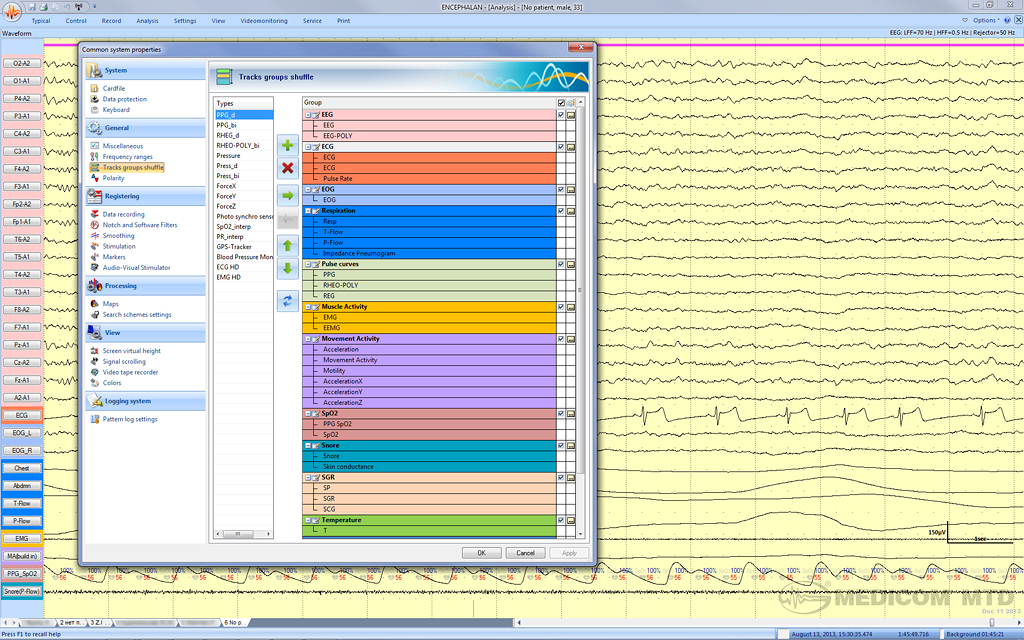
Viewing in split mode and comparison of power spectrums (graphs and maps) of fragments of background record and hyperventilation 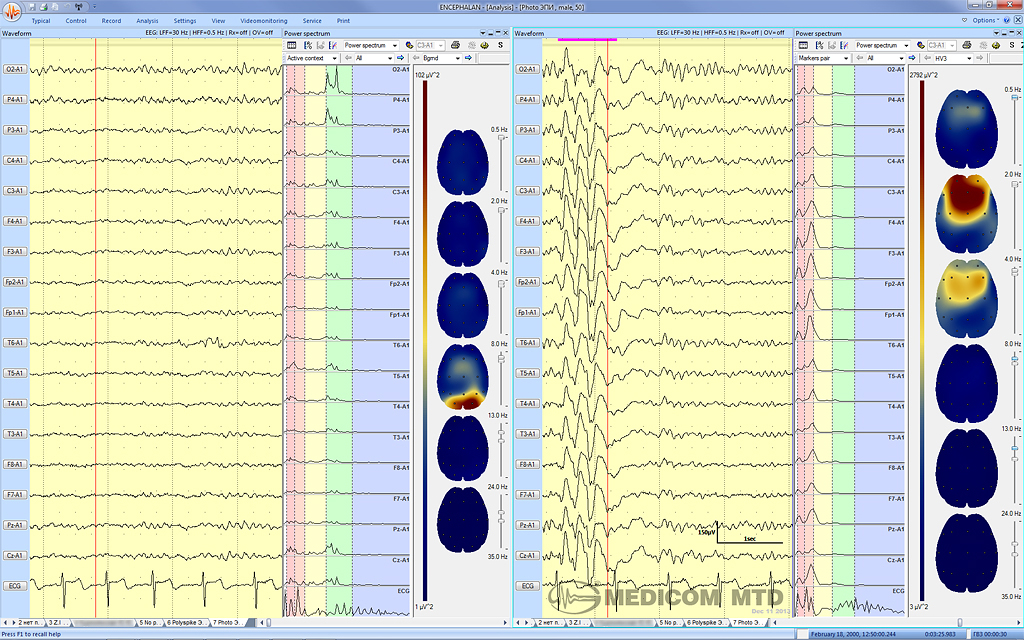
Split mode demonstrates: on the left – artifact from A2 reference in the left hemispheres channels, on the right – elimination of artifacts by applying "Моnopоlar A1" montage. 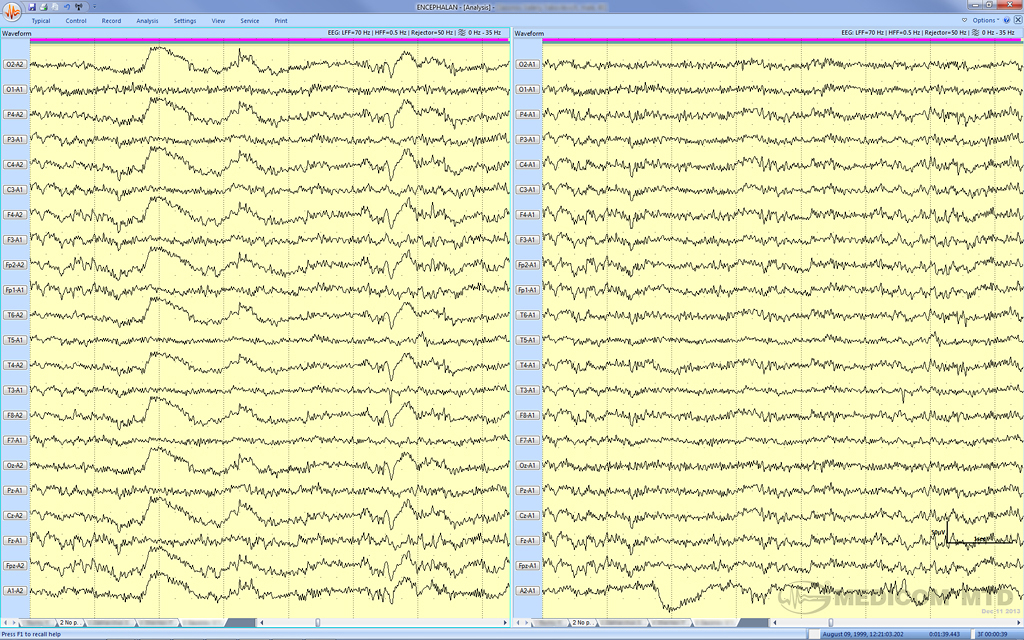
EEG spectral analysis of signals by all derivation in topical presentation, in the form of topographic maps and table values. 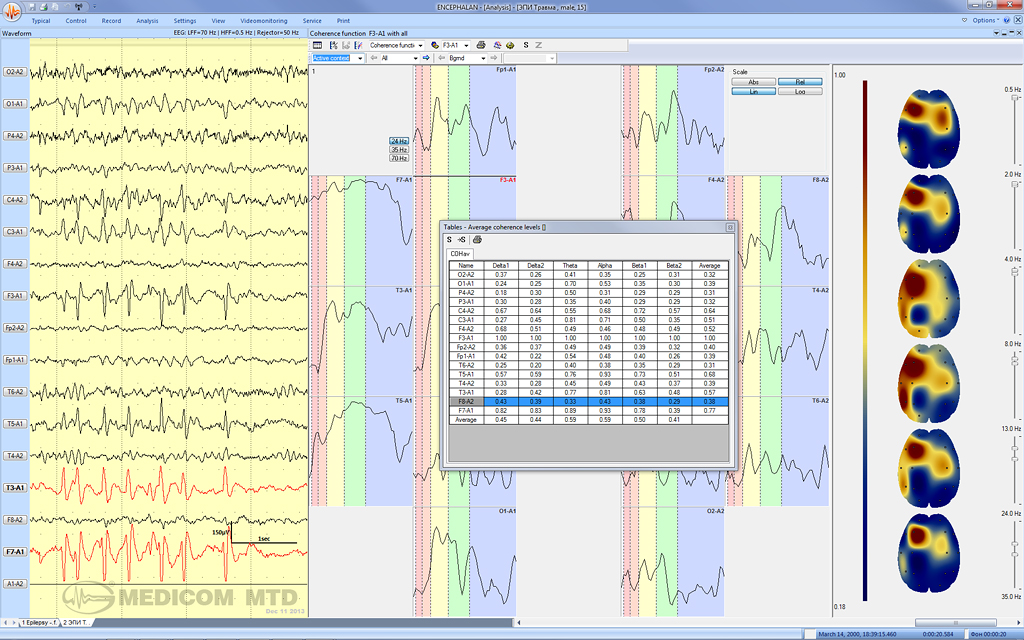
Presentation of the succession of spectra graphs corresponding to fragments of EEG study with selected time quantum or to succession of various FT for visual analysis in pseudo-3D form. 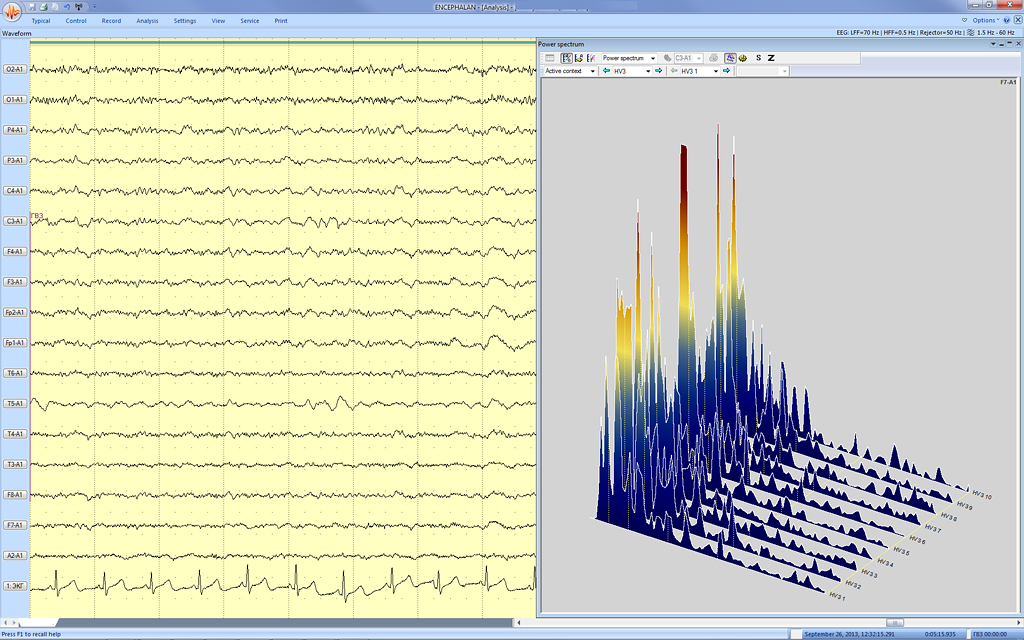
Measurement of amplitude EEG values and topographical 2D mapping of amplitude range (by length of curve, by normalized area) 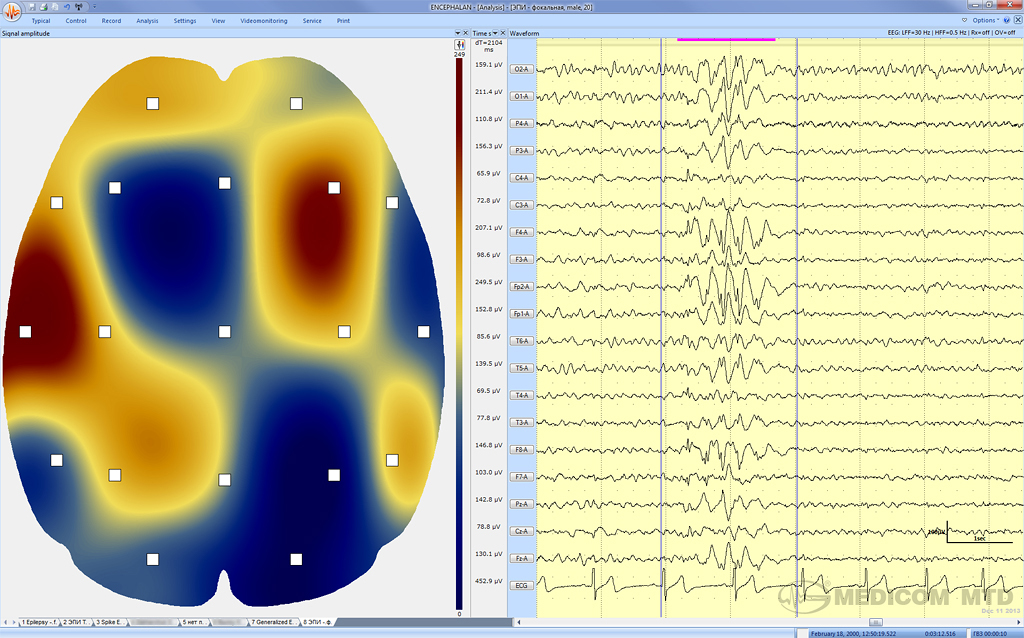
The figure illustrates amplitude 2D mapping of time slices for the purpose of expectative focal expressions detection 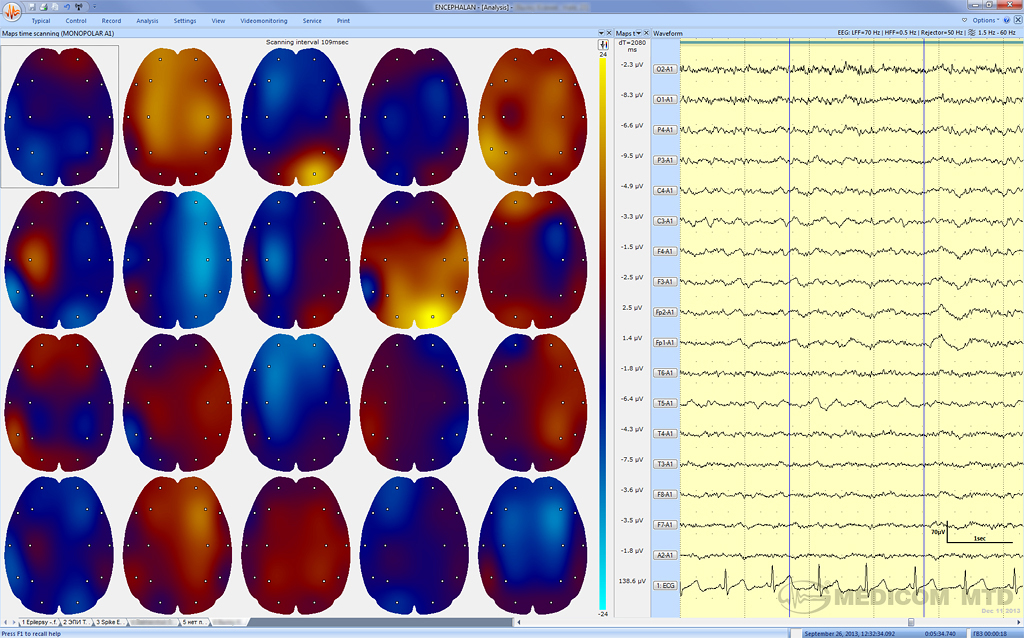
Initial EEG with detected oculomotor artifacts 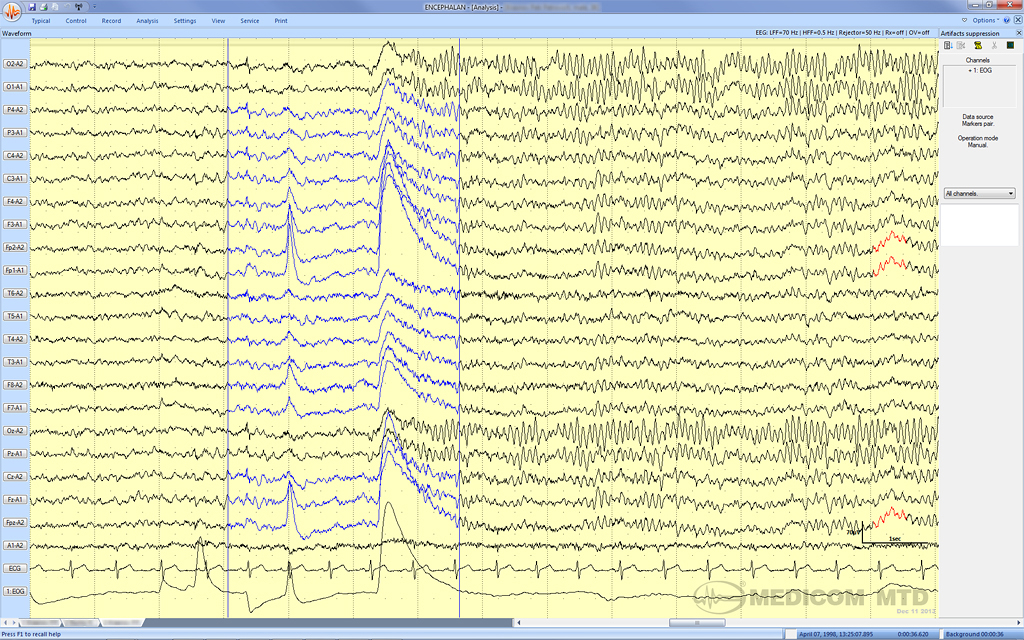
The same EEG fragment after oculogram artifacts compensation 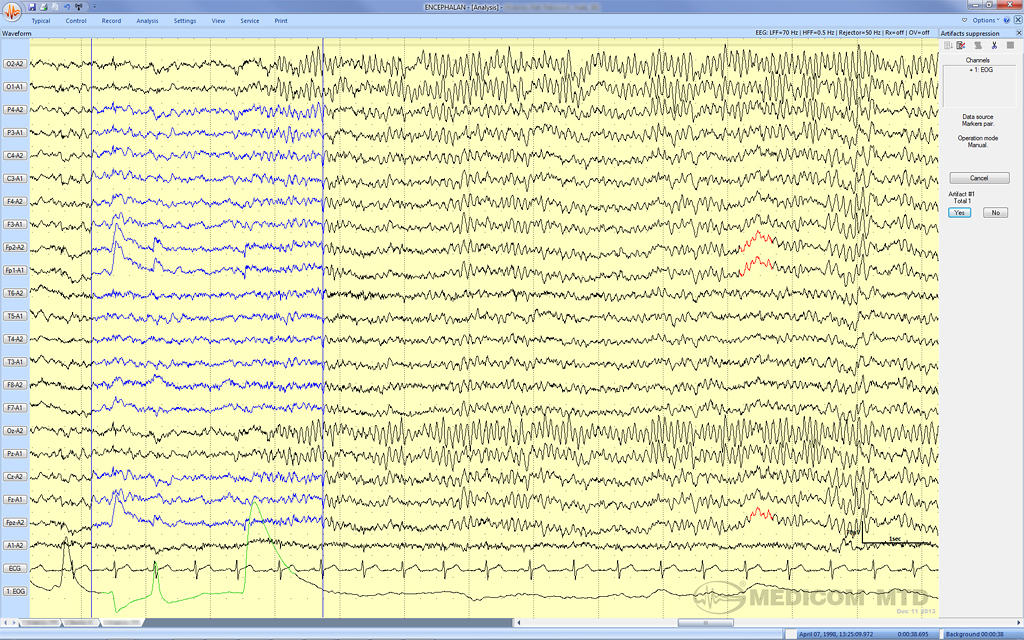
Print Manager 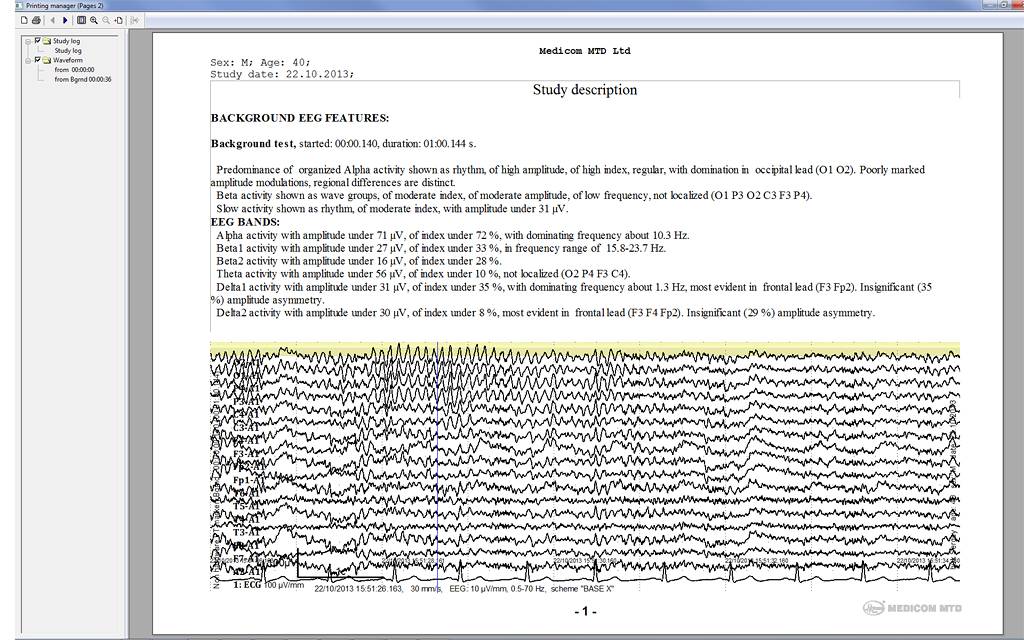
Database "Cardfile" 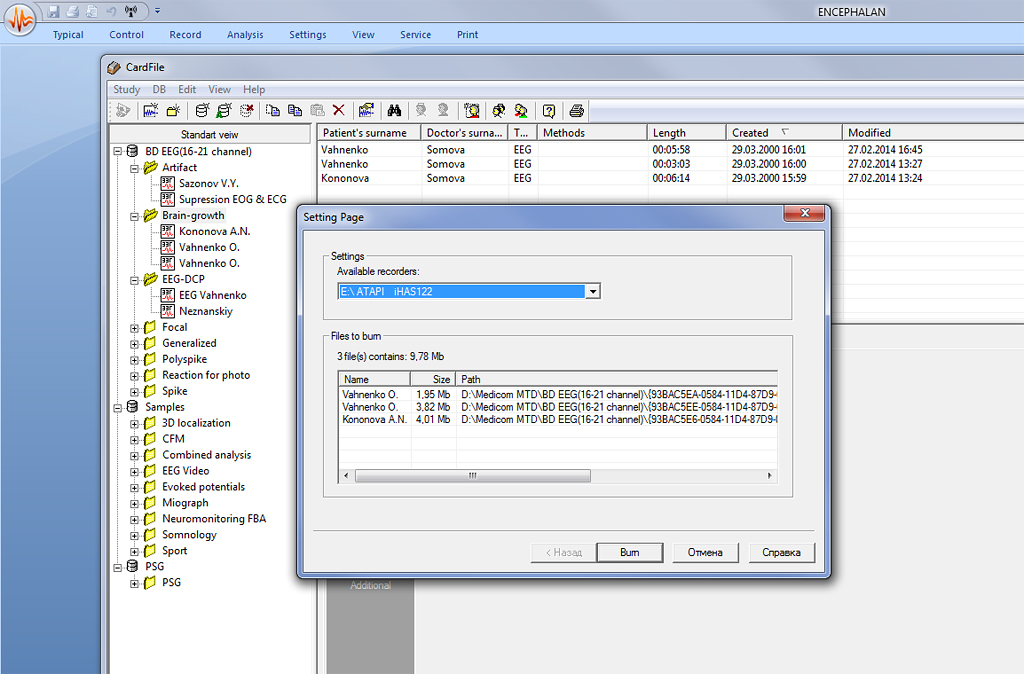
|