
A fragment of aEEG trend with some areas of a "burst-suppression" pattern. Picture shows time dynamics of automatically recognized aEEG events (burst-suppression, remains). 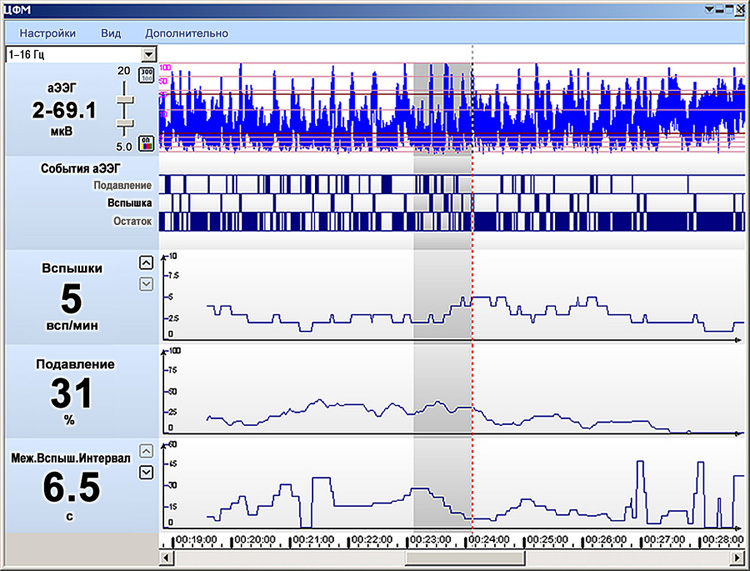

The example of compressed spectrum studies with periodically arising epileptiform bursts in the form of "spike-wave" complexes. 
The example of compressed spectrum studies with monitoring at drugs administration after surgery. Median frequency graph is overlapped additionally. 
The example of compressed spectrum studies in a patient in deep coma with deterioration in a patient's state and a flat (isoelectric) EEG. Graph of total power is overlapped additionally. 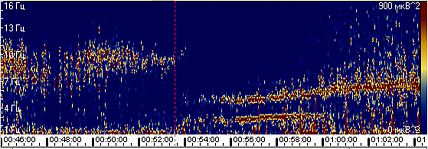
The example of compressed spectrum against the background of anesthesia. The alpha rhythm prevails in the beginning. A vertical line represents the moment of quick rhythms reformation: the disappearance of the alpha and the emergence of low-frequency rhythms (delta and theta). 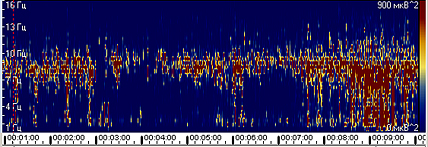
The example of compressed spectrum with prevailing alpha rhythm (8-10 Hz). The level of slow-wave activity (delta-theta) is increased by hyperventilation test. 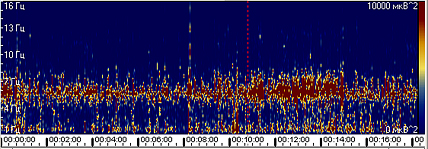
The example of compressed spectrum with prevailing alpha rhythm (5-7 Hz) in a 6-year-old child with neurophysiological immaturity of the brain. 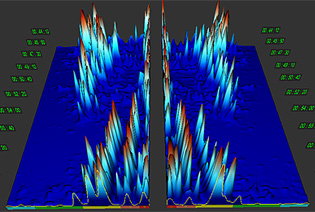
Compressed Spectral Array dynamics averaged over hemispheres in the process of an anesthetic injection. The picture shows the abrupt replacement of the high frequency EEG components (in the background) by the low-frequency EEG components (in the foreground). 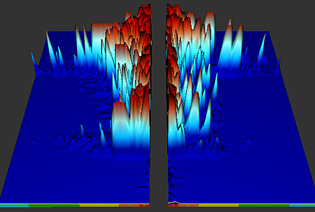
A fragment of compressed spectral array (CSA), which illustrates the presence of status epilepticus (sharp relief in the background) interrupted by medication (a sharp decline in the amplitude of relief can be pointed by an arrow). 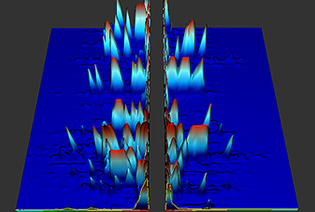
This study has the fragments of "burst-suppression" pattern. Recurring EEG bursts were accompanied by bursts in compressed spectral array dynamics. Preterm infant, 7 days. Hypoxic-ischemic encephalopathy and jaundice. "Burst-suppression" pattern with low values of EEG amplitude and recurring bursts typical for neurological disorders in neonatal period, severe asphyxia and metabolic disorders is detected on EEG signals and aEEG trends. The low-frequency slow-wave activity in the delta-1 range prevails on the trends of spectral power indices by ranges (SPIR). 
Trends of spectral power indices by ranges (SPIR) display the changes in EEG frequency content. They are displayed in the form of color trends with the width corresponding to the spectral index in percentage terms. 
SPIR trend with prevailing theta rhythm (5-7 Hz) in a 6-year-old child with neurophysiological immaturity of the brain. 
SPIR trend during monitoring in operating room against the background of anesthesia. With the deepening of anesthesia the delta-theta rate increases (brown, red and yellow areas). 
The example of cyclic changes in SPIR trend during sleep monitoring. Sleep stages affect the redistribution of EEG rhythms. 
The indented SPIR trend of an infant with prevailing low-frequency components in "burst-suppression" pattern. 
Monitoring in ICU. Abnormal increase in slow-wave activity is observed. 
SPIR trend during functional test conduction in an adult patient. Significant increase in delta-theta waves is observed at hyperventilation functional test. Synchronous cerebral function monitoring and neuromonitoring 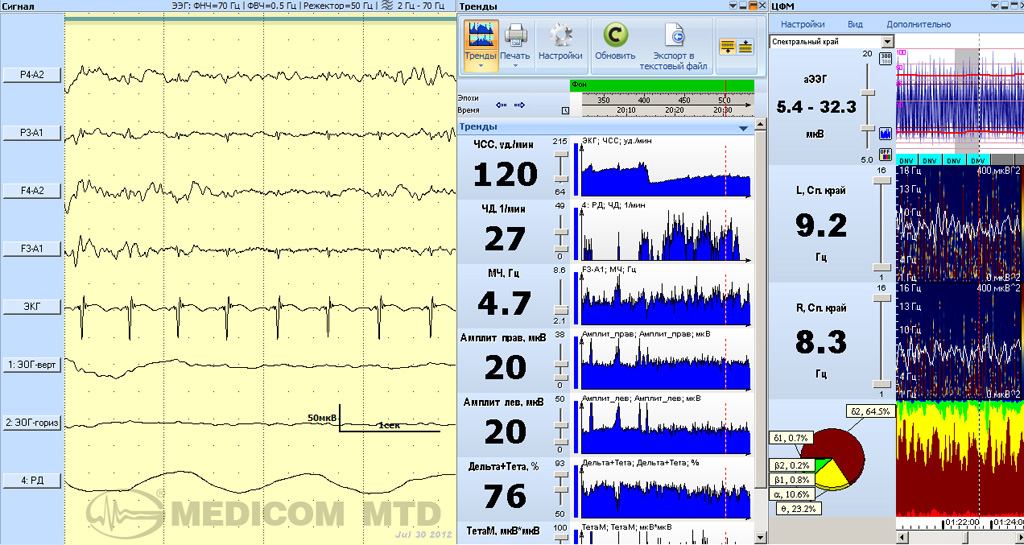
Synchronous cerebral function monitoring and EEG videomonitoring 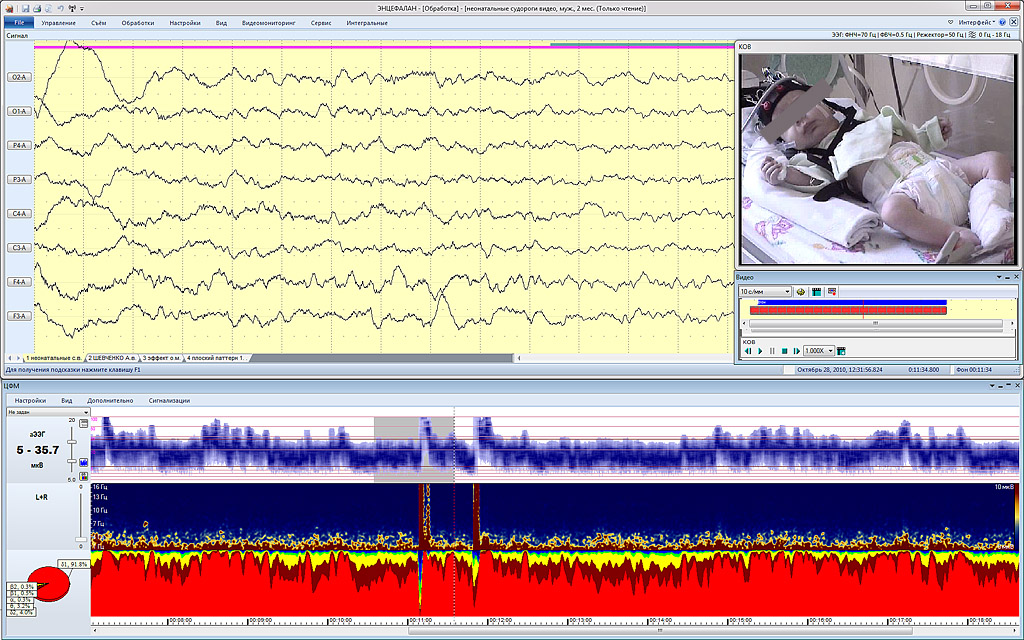
|